# Uncomment and install the following libraries if required
#!pip install rdkit-pypi pandas mols2grid matplotlibWhy this post?
Well, I’ve always had a thought sitting at the back of my mind about working on a chemistry-related data project. It was partly due to the research saga detailed in another blog post. About two months ago, I thought I will never be able to get anything decent (e.g. first-author paper) published out of my PhD, so I was thinking of going down the route of working on health data science, which was where I could tie in my pharmacist background. Miraculously, the paper actually got published last month, which meant I might have more career options now…
The funny thing was that before I knew this paper was coming, I’ve already made up my mind about working on at least one piece of chemistry-related work before leaving it behind completely. Therefore, this was how I got myself started on this post, a small piece of cheminformatics work on molecular similarity for selected COVID-19 antivirals, as taking my first baby step in this field.
Heads up
This work was coded entirely in Python3 and saved as .ipynb file initially in Jupyter Notebook. It was later converted into .qmd file via CLI1, which was run without problems in RStudio IDE. One thing to note was that all 2D chemical structures or similarity maps did not physically show up in RStudio IDE after code executions, but after file rendering, all of them appeared accordingly in the published version.
Source of dataset
The URLs to obtain canonical simplified molecular input line entry systems (SMILES) of all 5 molecules are listed below (there are several different ways to obtain SMILES for molecules, I’ve decided to use PubChem in this case):
Install modules/libraries
Install relevant libraries if needed.
Import libraries needed as shown below.
# RDKit chemistry
from rdkit import Chem
# RDKit drawing
from rdkit.Chem.Draw import IPythonConsole
from rdkit.Chem import Draw
# RDKit fingerprint generator
from rdkit.Chem import rdFingerprintGenerator
# RDKit functionality for basic data structures
from rdkit.Chem import DataStructs
# Settings to improve quality of structures
from rdkit.Chem import rdDepictor
# SVG = scalable vector graphics, set to false if wanting PNGs instead
IPythonConsole.ipython_useSVG = True
rdDepictor.SetPreferCoordGen(True)
# Add ability to add a molecule to a dataframe
from rdkit.Chem import PandasTools
# mols2grid library provides convenient way to display molecules in a grid
import mols2grid
# for dataframe manipulations
import pandas as pd
# for plotting graphs
import matplotlib.pyplot as plt
Generate RDKit molecules based on SMILES
Before any actual molecular manipulation work could begin, the SMILES of all 5 molecules were downloaded from the source URLs. I’ve downloaded all 5 molecules’ SMILES and saved them as separate .sdf files (selected 2D structure option).
So I started off with nirmatrelvir with its canonical SMILES retrieved from PubChem. To display a molecule as a 2D chemical structure graphically, an open-source cheminformatics toolkit library, RDKit, was used.
# Generate a RDKit molecule representing nirmatrelvir
nmt = Chem.MolFromSmiles("CC1(C2C1C(N(C2)C(=O)C(C(C)(C)C)NC(=O)C(F)(F)F)C(=O)NC(CC3CCNC3=O)C#N)C")
nmt
# Create a RDKit molecule for ritonavir using canonical SMILES
rit = Chem.MolFromSmiles("CC(C)C1=NC(=CS1)CN(C)C(=O)NC(C(C)C)C(=O)NC(CC2=CC=CC=C2)CC(C(CC3=CC=CC=C3)NC(=O)OCC4=CN=CS4)O")
rit# Create a RDKit molecule for molnupiravir using canonical SMILES
mol = Chem.MolFromSmiles("CC(C)C(=O)OCC1C(C(C(O1)N2C=CC(=NC2=O)NO)O)O")
mol# Create a RDKit molecule for remdesivir by using canonical SMILES
rem = Chem.MolFromSmiles("CCC(CC)COC(=O)C(C)NP(=O)(OCC1C(C(C(O1)(C#N)C2=CC=C3N2N=CN=C3N)O)O)OC4=CC=CC=C4")
rem# Create a RDKit molecule for baricitinib by using canonical SMILES
bar = Chem.MolFromSmiles("CCS(=O)(=O)N1CC(C1)(CC#N)N2C=C(C=N2)C3=C4C=CNC4=NC=N3")
barDisplay 2D molecules in grid view
To display all 5 molecules in a grid view, I’ve saved all separate .sdf files into one .sdf file (e.g. covid_antivirals.sdf). A quick way to do this was via CLI by using one line of code: cat *.sdf > file_name.sdf (replace “file_name” as the actual file name wanted). One thing to be aware of was to make sure which working directory this was saved to, as it needed to be in the same directory as the .qmd file for it to work.
# Save all 5 COVID-19 antivirals as a list in a cpds object
cpds = [x for x in Chem.SDMolSupplier("covid_antivirals.sdf")]
cpds
[<rdkit.Chem.rdchem.Mol at 0x121e69e70>,
<rdkit.Chem.rdchem.Mol at 0x12227e500>,
<rdkit.Chem.rdchem.Mol at 0x12227e490>,
<rdkit.Chem.rdchem.Mol at 0x12227d5b0>,
<rdkit.Chem.rdchem.Mol at 0x12227d620>]Well, this flexible grid view with function to select molecules would be much more useful if there were several thousands of molecules downloaded. I was just basically trialling this as a practice, which turned out quite nicely.
# Display all compounds in a flexible grid view with selection function
mols2grid.display(cpds)
Then I thought about adding drug names to each molecule, rather than listing their IUPAC3 names, for the sake of easier reading and viewing. One of the ways to do this was to add legend with the drug names in the same order.
# Display compounds in grid view with drug names shown
Draw.MolsToGridImage(cpds,
                     molsPerRow = 3,
                     legends = ("baricitinib", "molnupiravir", "nirmatrelvir", "remdesivir", "ritonavir"),
                     subImgSize=(300, 300),
                     useSVG = True
                    )
Similarity maps
Now this part was interesting to me and I’ve spent at least a day or two to just try and understand the fundamentals behind this functionality in RDKit. One of the biggest help for me to fully understand this was this paper: Riniker, S.; Landrum, G. A. “Similarity Maps - A Visualization Strategy for Molecular Fingerprints and Machine-Learning Methods” J. Cheminf. 5:43 (2013). It explained the full methodology behind generating similarity map between compounds using molecular fingerprints.
# Build similarity maps between molecules
# Import additional libraries needed
from rdkit.Chem.Draw import SimilarityMaps
import io
from PIL import Image
The following step was important to ensure a good image of the map was produced for the molecules, by creating a function for “show_png” first, which was used later.
# Binary i/o keeps data as bytes in an in-memory buffer
# A function that creates a bytes object as an image
def show_png(data):
    bio = io.BytesIO(data)
    img = Image.open(bio)
    return img
I’ve randomly set nirmatrelvir as the reference compound. The other 4 molecules were set as test or probe molecules to be compared with the reference compound. So here I’ve compared nirmatrelvir with ritonavir first.
# Create a Draw2D object "a" and specify size of 2D image
a = Draw.MolDraw2DCairo(500, 500)
# Produces a similarity map for nirmatrelvir and ritonavir
# Specify which compounds to compare (reference and probe) for the similarity map
fig, maxweight = SimilarityMaps.GetSimilarityMapForFingerprint(nmt, rit,
                                                               # creates a lambda function (anonymous function) for use within SimilarityMaps,
                                                               # then select fingerprint type e.g. Morgan fingerprint
                                                               # types of Morgan fingerprint: bit vector (bv, default) & count vector (count)
                                                               lambda b, c: SimilarityMaps.GetMorganFingerprint(b, c, radius = 2, fpType = 'bv'),
                                                               draw2d = a)

# Finish drawing Draw2D object "a"
a.FinishDrawing()
# Display similarity map
show_png(a.GetDrawingText())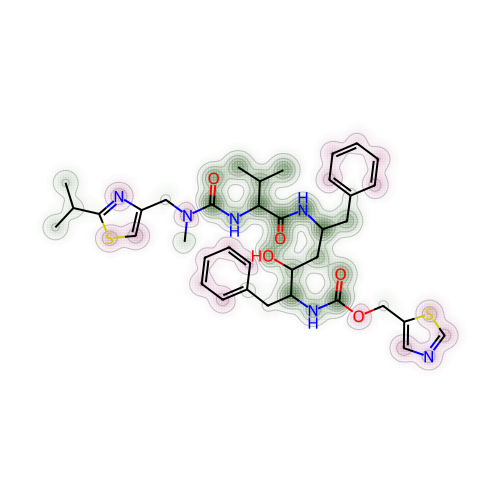
To quickly explain how to look at the contour or topographical map in different colours for the molecule:
Green shades represented a positive difference or where the similarity decreased when the bits4 were removed
Pink shades showed negative difference or where the similarity increased when the bits were removed
Grey shades meant there was no change
Another parameter that might allow us to interpret more easily was to obtain the maximum weight (also known as “maxweight” in the code) for the structure comparison between two molecules. Maximum weight could be understood as maximum difference between the reference and probe molecules. By default, maximum weight was capped at 1.0. This function was already built in above code, so to find out the maximum weight or difference for nirmatrelvir and ritonavir, simply just use the print() function.
# Max weight between nirmatrelvir and ritonavir
print(maxweight)0.03389096421417358I’ve then saved this particular maxweight result with a different label name (to clearly show which molecules were being compared), for later use.
mol2_rit_maxw_mol1 = maxweight
mol2_rit_maxw_mol10.03389096421417358To further explain and understand the parameter of maximum weight, this paper by Riniker and Landrum have included a full calculation styled as pseudocodes in Python. I have attempted to summarise them in words, along with the codes (adapted from the paper), as below:
```{python}
# 1. Calculate the fingerprint for reference molecule
ref_fp = calculate_fingerprint (ref_mol)

# 2. Calculate the fingerprint for test molecule
this_fp = calculate_fingerprint (this_mol)

# 3. Create an empty weights list
weights = []

# 4. Calculate original similarity for ref mol & test mol based on Dice similarity
orig_simil = dice_similarity(ref_fp, this_fp)

# 5. Loop over the different atoms present in the test mol
for atom in this_mol.get_atoms:

# 5. (cont.) Generate a new fingerprint by calculating new fingerprints without each of the atom for the test mol
    new_fp = calculate_fingerprint_without_atom(this_mol, atom)

# 5. (cont.) Calculate new similarity for the ref fingerprint & new fingerprint based on Dice similarity
    new_simil = dice_similarity(ref_fp, new_fp)

# 6. The atomic weight will be calculated as the difference between the original similarity and the new similarity
weight = original_simil - new_simil

# 7. The atomic weight obtained for each loop iteration (for each atom present) will be added up to contribute to the final atomic weight
weights.append(weight)

# Note: maximum absolute weight is normalised and capped at 1.0
```
Next one was between nirmatrelvir and molnupiravir. I’ve renamed “maxweight” to “mol3_mol_maxw_mol1” to reflect this parameter was measured between 3rd molecule (molnupiravir) and 1st molecule (nirmatrelvir).
# 2. Comparing nirmatrelvir and molnupiravir
a = Draw.MolDraw2DCairo(400, 400)
# Produces a similarity map for molecules selected
# Specify which compounds to compare (reference and probe) for the similarity map
fig, mol3_mol_maxw_mol1 = SimilarityMaps.GetSimilarityMapForFingerprint(nmt, mol,
                                                               # creates a lambda function (anonymous function) for use within SimilarityMaps,
                                                               # then select fingerprint type e.g. Morgan fingerprint
                                                               # types of Morgan fingerprint: bit vector (bv, default) & count vector (count)
                                                               lambda b, c: SimilarityMaps.GetMorganFingerprint(b, c, radius = 2, fpType = 'bv'),
                                                               draw2d = a)

# Finish drawing Draw2D object "a"
a.FinishDrawing()
# Display similarity map
show_png(a.GetDrawingText())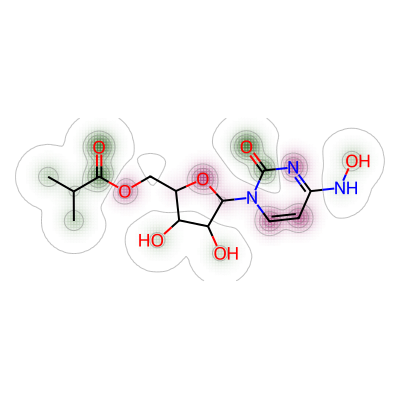
The maximum weight between nirmatrelvir and molnupiravir was shown as below.
print(mol3_mol_maxw_mol1)0.026617250673854453Similarity map was then generated for nirmatrelvir and remdesivir.
# 3. Comparing nirmatrelvir and remdesivir
a = Draw.MolDraw2DCairo(400, 400)
# Produces a similarity map for molecules selected
# Specify which compounds to compare (reference and probe) for the similarity map
fig, mol4_rem_maxw_mol1 = SimilarityMaps.GetSimilarityMapForFingerprint(nmt, rem,
                                                               # creates a lambda function (anonymous function) for use within SimilarityMaps,
                                                               # then select fingerprint type e.g. Morgan fingerprint
                                                               # types of Morgan fingerprint: bit vector (bv, default) & count vector (count)
                                                               lambda b, c: SimilarityMaps.GetMorganFingerprint(b, c, radius = 2, fpType = 'bv'),
                                                               draw2d = a)

# Finish drawing Draw2D object "a"
a.FinishDrawing()
# Display similarity map
show_png(a.GetDrawingText())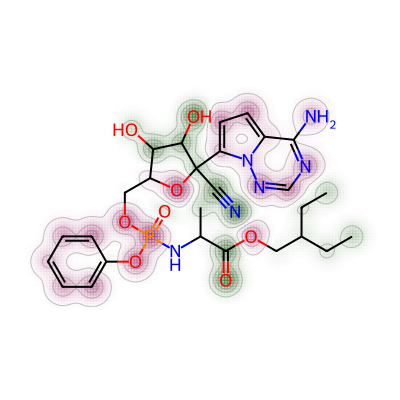
Their maximum weight was found as below.
print(mol4_rem_maxw_mol1)0.021674876847290636Lastly, the comparison was made between nirmatrelvir and baricitinib.
# 4. Comparing nirmatrelvir and baricitinib
a = Draw.MolDraw2DCairo(400, 400)
# Produces a similarity map for molecules selected
# Specify which compounds to compare (reference and probe) for the similarity map
fig, mol5_bar_maxw_mol1 = SimilarityMaps.GetSimilarityMapForFingerprint(nmt, bar,
                                                               # creates a lambda function (anonymous function) for use within SimilarityMaps,
                                                               # then select fingerprint type e.g. Morgan fingerprint
                                                               # types of Morgan fingerprint: bit vector (bv, default) & count vector (count)
                                                               lambda b, c: SimilarityMaps.GetMorganFingerprint(b, c, radius = 2, fpType = 'bv'),
                                                               draw2d = a)

# Finish drawing Draw2D object "a"
a.FinishDrawing()
# Display similarity map
show_png(a.GetDrawingText())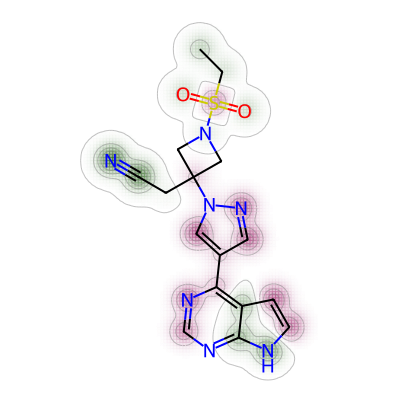
The maximum weight was found as below.
print(mol5_bar_maxw_mol1)0.026242075777679508Short summary:
Nirmatrelvir vs. remdesivir had the smallest maximum weight or difference out of all 5 compounds
Nirmatrelvir vs. ritonavir had the biggest maximum weight or difference out of all compounds, the second biggest one would be between nirmatrelvir and molnupiravir
Fingerprint generator
After using the similarity maps, I found more things to trial in RDKit, and this one was a fingerprint generator. I’ve decided to use the same 5 molecules as before, and see if I could get similar results.
# Re-label molecules for later use
mol1 = nmt
mol2 = rit
mol3 = mol
mol4 = rem
mol5 = bar

# Combine all 5 molecules into a list
mols = [mol1, mol2, mol3, mol4, mol5]
Below was the set of codes used to generate a fingerprint between compounds. I’ve changed the radius to 2 to align with the similarity map test above.
# Create an object fp to generate fingerprint
# Default radius of molecule = 3
fp = rdFingerprintGenerator.GetMorganGenerator(radius = 2)
# Get fingerprints of all molecules in the list
fp1 = [fp.GetFingerprint(x) for x in mols]
fp1
[<rdkit.DataStructs.cDataStructs.ExplicitBitVect at 0x12227d540>,
<rdkit.DataStructs.cDataStructs.ExplicitBitVect at 0x12227ea40>,
<rdkit.DataStructs.cDataStructs.ExplicitBitVect at 0x12227e6c0>,
<rdkit.DataStructs.cDataStructs.ExplicitBitVect at 0x12227e8f0>,
<rdkit.DataStructs.cDataStructs.ExplicitBitVect at 0x12227e730>]A loop was created to iterate through all 5 antivirals to compare their molecular similarities by using Tanimoto coefficient (TC)5. Particularly, each molecule was compared to the other 4 molecules, with results printed as shown below.
for i in range(len(fp1)):
    for a in range(i):
        tc = DataStructs.TanimotoSimilarity(fp1[i], fp1[a])
        print(f'mol{i+1}-mol{a+1}: Tanimoto coefficient {tc}')
mol2-mol1: Tanimoto coefficient 0.08461538461538462
mol3-mol1: Tanimoto coefficient 0.10891089108910891
mol3-mol2: Tanimoto coefficient 0.14953271028037382
mol4-mol1: Tanimoto coefficient 0.10687022900763359
mol4-mol2: Tanimoto coefficient 0.1386861313868613
mol4-mol3: Tanimoto coefficient 0.19811320754716982
mol5-mol1: Tanimoto coefficient 0.11214953271028037
mol5-mol2: Tanimoto coefficient 0.09243697478991597
mol5-mol3: Tanimoto coefficient 0.10989010989010989
mol5-mol4: Tanimoto coefficient 0.15517241379310345I then saved each TC separately between nirmatrelvir and other 4 molecules. This was to create another list of these TCs for data visualisation later.
# Tanimoto coefficient between nirmatrelvir (mol1) & ritonavir (mol2)
tc_mol1_mol2 = DataStructs.TanimotoSimilarity(fp1[0], fp1[1])

# Tanimoto coefficient between nirmatrelvir (mol1) & molnupiravir (mol3)
tc_mol1_mol3 = DataStructs.TanimotoSimilarity(fp1[0], fp1[2])

# Tanimoto coefficient between nirmatrelvir (mol1) & remdesivir (mol4)
tc_mol1_mol4 = DataStructs.TanimotoSimilarity(fp1[0], fp1[3])

# Tanimoto coefficient between nirmatrelvir (mol1) & baricitinib (mol5)
tc_mol1_mol5 = DataStructs.TanimotoSimilarity(fp1[0], fp1[4])
A new list was created to save all TCs for nirmatrelvir versus other 4 molecules.
tc_mols = [tc_mol1_mol2, tc_mol1_mol3, tc_mol1_mol4, tc_mol1_mol5]
tc_mols
[0.08461538461538462,
0.10891089108910891,
0.10687022900763359,
0.11214953271028037]I thought to include following codes to ensure I wasn’t losing track on which molecule was which by having them displayed as 2D structures with labels.
# Display compounds to help with recognising which antivirals are being compared
Draw.MolsToGridImage(mols,
                     molsPerRow = 3,
                     legends = ("mol1 = nirmatrelvir", "mol2 = ritonavir", "mol3 = molnupiravir", "mol4 = remdesivir", "mol5 = baricitinib"),
                     subImgSize=(300, 300),
                     useSVG = True
                    )
Another list was generated to save all maximum weights between nirmatrelvir and the rest of the molecules.
maxw_diff = [mol2_rit_maxw_mol1, mol3_mol_maxw_mol1, mol4_rem_maxw_mol1, mol5_bar_maxw_mol1]
maxw_diff
[0.03389096421417358,
0.026617250673854453,
0.021674876847290636,
0.026242075777679508]A new dataframe was also created to include maximum weights and TCs of all 5 molecules.
df_ms = pd.DataFrame(list(zip(maxw_diff, tc_mols)),
                     index = ['nmt_v_rit', 'nmt_v_mol', 'nmt_v_rem', 'nmt_v_bar'],
                     columns = ['Maxweight', 'T_coeff']
                    )
df_ms| Maxweight | T_coeff | |
|---|---|---|
| nmt_v_rit | 0.033891 | 0.084615 |
| nmt_v_mol | 0.026617 | 0.108911 |
| nmt_v_rem | 0.021675 | 0.106870 |
| nmt_v_bar | 0.026242 | 0.112150 |
To produce a bar graph representing these parameters, I realised I would probably need to change the index into a column instead.
df_ms.reset_index(inplace = True)
df_ms_new = df_ms.rename(columns = {'index': 'Molecules'})
df_ms_new| Molecules | Maxweight | T_coeff | |
|---|---|---|---|
| 0 | nmt_v_rit | 0.033891 | 0.084615 |
| 1 | nmt_v_mol | 0.026617 | 0.108911 |
| 2 | nmt_v_rem | 0.021675 | 0.106870 |
| 3 | nmt_v_bar | 0.026242 | 0.112150 |
Data visualisation and some findings
A side-by-side bar graph showing two different molecular similarity parameters - maximum weights from similarity map and TCs calculated from Morgan fingerprints - was plotted based on the dataframe created above. It showed similar trend between these two molecular similarity tests for these known COVID-19 antivirals. In that, nirmatrelvir versus ritonavir showed the largest molecular difference out of all 5 compounds with the highest maximum weight. This was reflected in the lowest TC as the shortest orange bar, which implied a low similarity between the two molecules. Interestingly, between nirmatrelvir and remdesivir, it appeared the maximum weight was lowest of all 5 molecules, but the TC did not quite reflect that (being lower than that for nirmatrelvir versus molnupiravir and baricitinib).
# Set the overall font size to make all labels on graph easier to read
plt.rcParams.update({'font.size': 10})

# Used nirmatrelvir as reference compound (mol1) and compared it with 4 other antivirals
# If wanting stacked bar graph:
#df_ms_new.plot(x = 'Molecules',
               #kind = 'bar',
               #width = 0.3,
               #stacked = True,
               #title = 'Molecular similarities between 5 known COVID-19 antivirals'
               #)
#plt.show()

# Side-by-side bar graph
df_ms_new.plot(x = 'Molecules',
               y = ['Maxweight', 'T_coeff'],
               kind = 'bar',
               figsize = (7, 7)
               )
# Add title
plt.title(label = 'Molecular similarities between 5 known COVID-19 antivirals')

# Add caption for graph re. abbreviations of all the molecules compared
# Import textwrap module
import textwrap
t = "nmt = nirmatrelvir, "\
    "rit = ritonavir, "\
    "mol = molnupiravir, "\
    "rem = remdesivir, "\
    "bar = baricitinib"
b = textwrap.fill(t, width = 58)
x = 'Molecules'
y = ['Maxweight', 'T_coeff']
plt.text(len(x) / 2, 0, b, ha = 'left', va = 'bottom')
Text(4.5, 0, 'nmt = nirmatrelvir, rit = ritonavir, mol = molnupiravir,\nrem = remdesivir, bar = baricitinib')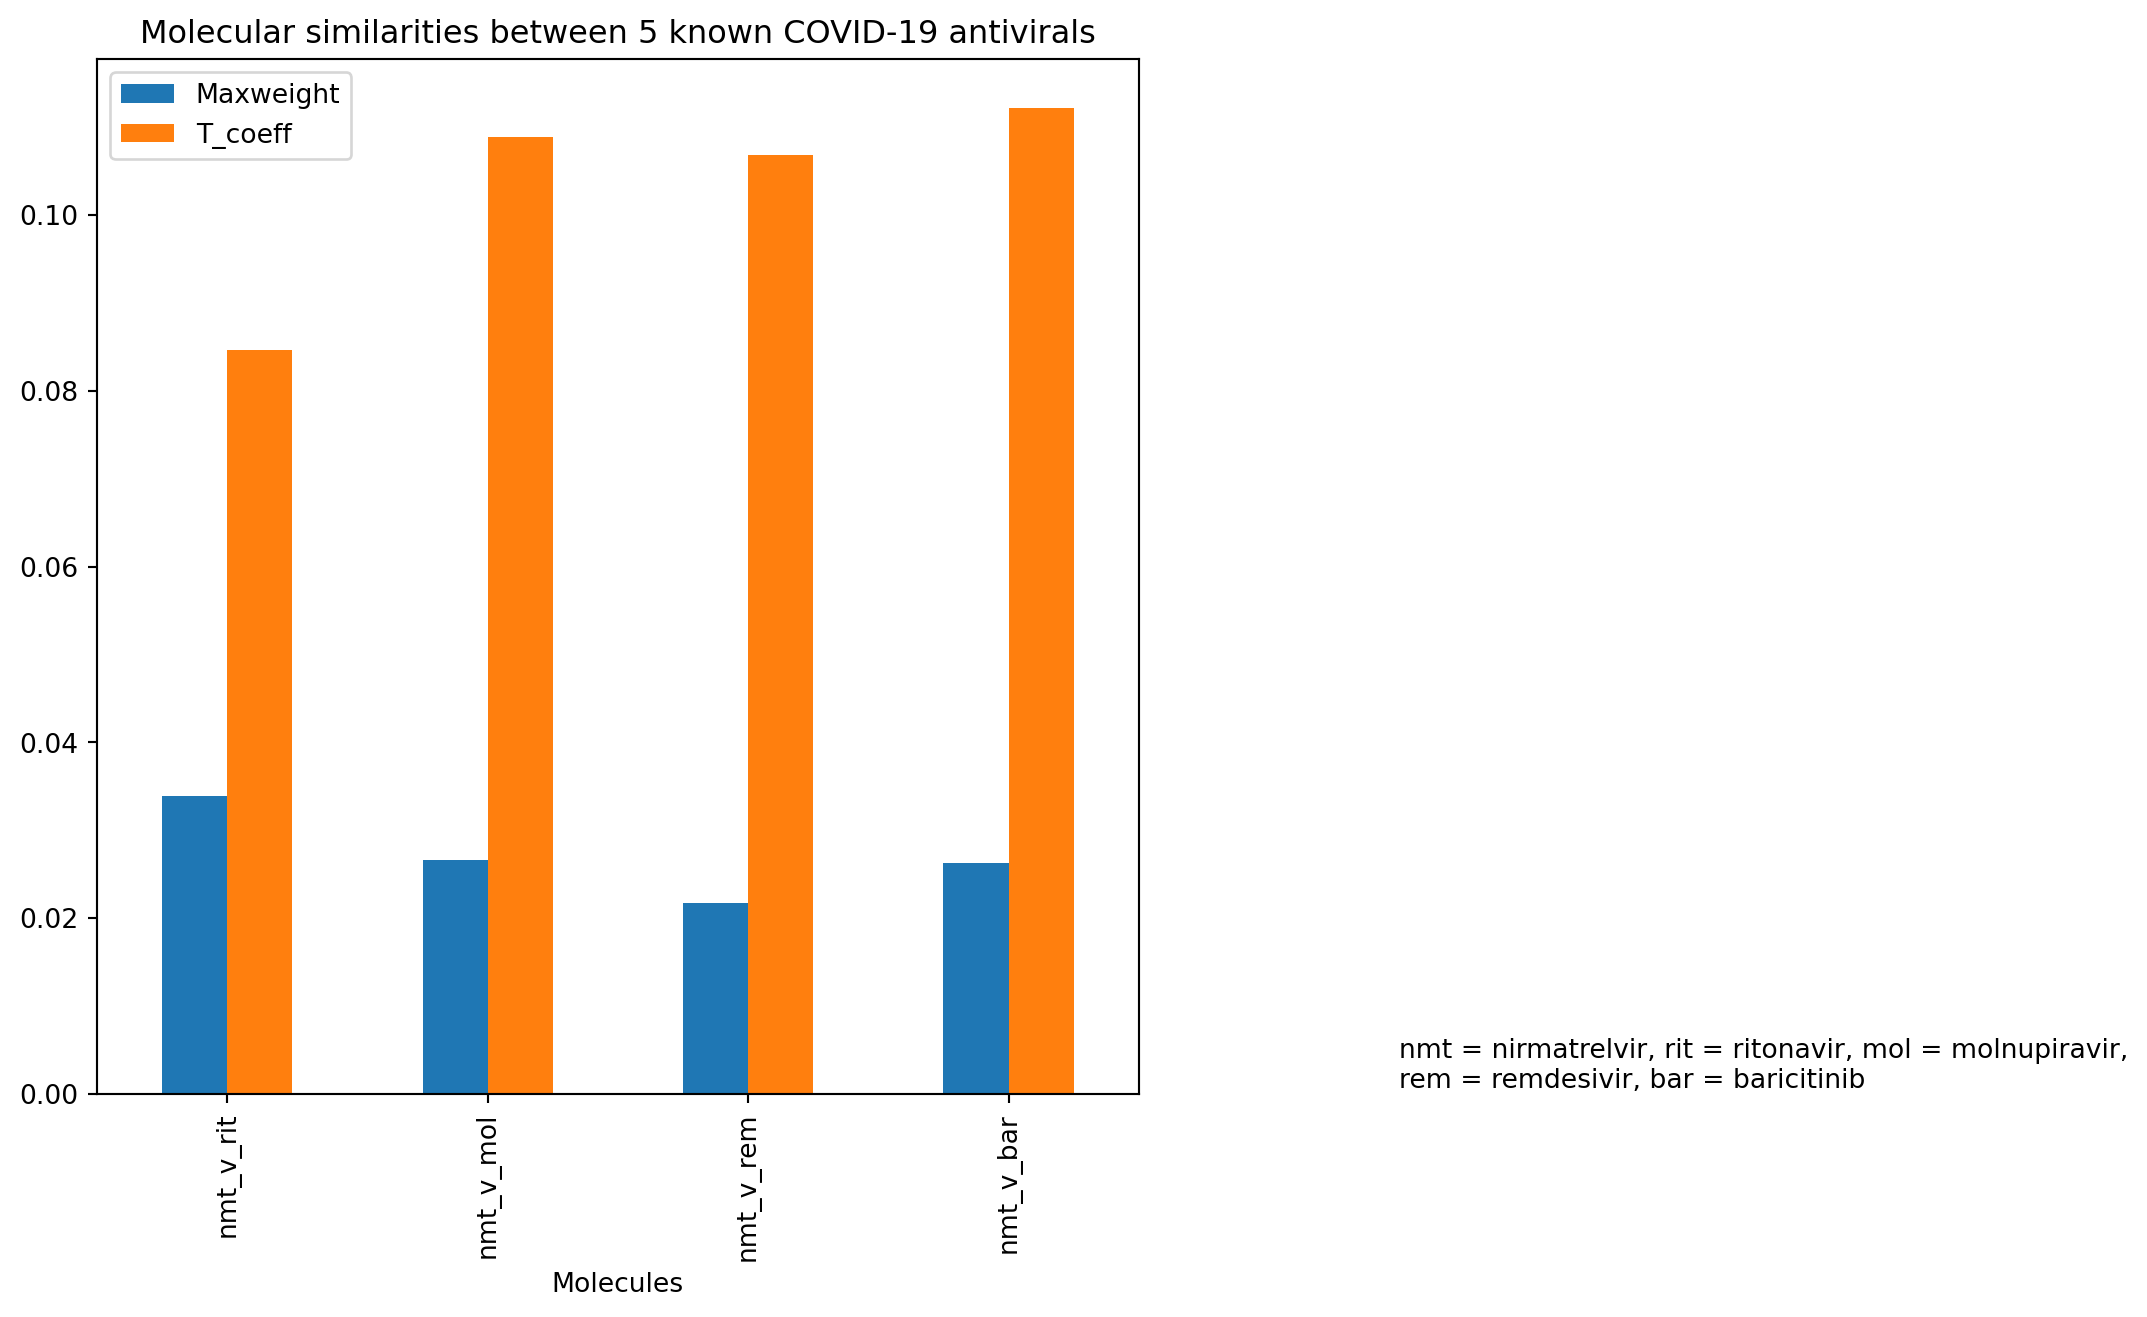
One possibility for this difference could be that the maximum weight parameter in the similarity map test was based on Dice similarity (if referring back to the pseudocodes for how to calculate atomic weight), but for the other fingerprint generator test, Tanimoto similarity (also known as Jaccard coefficient) was used instead. These two similarity coefficients were actually calculated differently, with their equivalent equations shown below.
Tanimoto similarity/coefficient
TC was the ratio of the number of chemical features common to two molecules (e.g. molecule a and molecule b) to the total number of chemical features in the two molecules. The following equation summarised this.
\[ \text{Tanimoto coefficient} = \frac{(a \cap b)}{(a + b - (a \cap b))} \]
Dice similarity/coefficient
On the other hand, Dice coefficient described the number of features in common for molecules a and b, relative to the average size of the total number of chemical features present in the two molecules. The weighting factor of 0.5 was shown in the denominator (or can be 2 in the numerator). The coefficient also ranges from zero to 1. The following showed the equation of Dice similarity.
\[ \text{Dice coefficient} = \frac{(a \cap b)}{0.5\times(a + b)} \]
Acknowledgement
The codes used in this post were heavily inspired by and adapted from the following blogs and website shown below. I’ve learnt a lot from them, and would like to thank the existence of these blogs and website, which are helping readers like me to learn in an open-source manner. I particularly like the clear and concise writing style from P. Walter’s Practical Cheminformatics blog which is easy to follow. Iwatobipen’s is life worth living? blog has shown a very diverse range of cheminformatics tools available for use, and I’m constantly surprised by how many there are from this blog and also the generous sharing of all the codes.
- P. Walter’s blog
- Iwatobipen’s blog
- RDKit documentation by G. Landrum
Final words
I have read quite a few blog posts from P. Walter and Iwatobipen, and have enjoyed them but never quite got around to write one myself, so finally I did it! Although this post itself was not written in a grand scale, and I would warmly welcome comments for improvements or corrections, I hope to project what I did here in the future, e.g. to apply them to a much larger set of compounds. My very draft thought now is to perhaps trial using ChEMBL database, which is a well-known open-source cheminformatics library.
As a little prelude to what other work I’m planning to do, I’ve managed to start learning Rust as well. There is a back story about why I’ve started learning Rust, which I’ll leave as a probable new post in the future if I feel it fits the context of the post. From what I’ve tried so far, only at seedling stage, it’s going to be an even steeper learning curve than Python and R, but I feel it’s going to benefit whatever I’m planning to do consciously or unconsciously in the future.
Footnotes
Command line interface↩︎
Cytochrome P450 enzymes of 3A subfamily↩︎
International Union of Pure and Applied Chemistry↩︎
Bits in a bit vector or counts in a count vector are converted from structural features in chemical structures to formulate molecular fingerprints, which subsequently allows a more efficient way to compare chemical structures computationally↩︎
Ranged from zero (lowest similarity) to 1.0 (highest similarity), more on this in the next section↩︎