Small molecules in ChEMBL database

Cross-validation & hyper-parameter tuning with scikit-learn

Machine learning projects
Scikit-learn
Python
ChEMBL database
Cheminformatics
Author

Jennifer HY Lin

Published

March 7, 2023

Machine learning in drug discovery - series 2


Introduction

This work was really a continuation of the first machine learning (ML) in drug discovery series, “Small molecules in ChEMBL database - Polars dataframe library and machine learning in scikit-learn” (referred to as ML series 1 from here onwards). In particular, I wanted to work on the logistics regression (LR) model, and look into other strategies that I could use to improve it. Last time, I used LogisticRegression() method on the df_ml dataframe (df_ml_pd was the actual dataframe name used in ML series 1, to denote a conversion from a Polars to Pandas dataframe). I’ve not changed any parameters for the LR estimator, which meant everything was kept at default settings. Overall, this was an example of a default prototype of a LR classifer, which most likely would be too simplistic and not really reflecting real-world equivalents, but it sort of helped me to think in terms of a LR and ML context.

This time, with a goal of trying to improve the model, I’ve planned to use cross-validation and hyper-parameter tuning at least to evaluate the estimator performance. It was also worth evaluating whether LR was the best ML approach for the df_ml dataset, which would likely need to be kept as a separate post to avoid another lengthy read. I also, on the other hand, have had an idea in mind of doing a ML series 3 looking at re-training the model and a final evaluation, which would keep me busy in the coming weeks.

Note

In scikit-learn, an estimator is alluding to the variety of ML approaches (as one of my interpretations), which are usually grouped into classification (e.g. naive Bayes, logistic regression), regression (e.g. support vector regression), clustering (e.g. K-means clustering) and dimensionality reduction (e.g. principal component analysis). A useful guide to help with choosing the right estimator can be found here. For a full definition of what an estimator is, refer to this link.


Machine learning series - overall plan

The overall plan for the ML series for small molecules in ChEMBL database could be visualised through the following flow chart, which was adapted and modified from the section on cross-validation in scikit-learn. This current post was targeting the ML series 2 subgraph area.

%%{ init: { 'flowchart': { 'curve': 'monotoneY' } } }%%
flowchart TB
  subgraph ML series 1
  A[Cleaned dataset] --> B(Train data)
  A --> C(Test data)
  end
  subgraph ML series 3
  B --> D(Re-train model)
  C --> E[Final evaluation]
  D --> E
  end
  subgraph ML series 2
  B --> G([Cross validation & hyper-parameter tuning])
  G --> H([Best parameters])
  F([Parameters]) --> G
  H --> D
  end


Import dataframe from ML series 1

Since scikit-learn mainly supports Pandas dataframes for ML, I’ve opted to use Pandas instead of Polars dataframe library this time, to avoid the extra step of converting a Polars dataframe into a Pandas one.

import pandas as pd

I’ve exported the final dataframe from ML series 1 as a .csv file, so that we could continue on this ML series and work on the LR model further. For this ML series 2, the .csv file was imported as shown below.

df_ml = pd.read_csv("df_ml.csv")
df_ml.head()
Max_Phase #RO5 Violations QED Weighted CX LogP CX LogD Heavy Atoms
0 0 0 0.91 2.05 0.62 21
1 0 2 0.16 1.51 -0.41 48
2 0 2 0.20 5.05 3.27 46
3 0 0 0.53 3.21 3.21 24
4 0 1 0.14 2.80 2.80 37
# Check rows and columns of the df_ml dataframe if needed
#df_ml.shape


Import libraries for machine learning
# Install scikit-learn - an open-source ML library
# Uncomment the line below if needing to install this library
#!pip install -U scikit-learn
# Import scikit-learn
import sklearn

# Check version of scikit-learn 
print(sklearn.__version__)
1.2.0

Other libraries needed to generate ML model were imported as below.

# To use NumPy arrays to prepare X & y variables
import numpy as np

# To normalise dataset prior to running ML
from sklearn import preprocessing
# To split dataset into training & testing sets
from sklearn.model_selection import train_test_split


Logistic regression

To get the LR model ready, the X and y variables were defined with the same sets of physicochemical features from the small molecules in the df_ml dataset.


Defining X and y variables
# Define X variables from df_ml dataset
X = np.asarray(df_ml[["#RO5 Violations", 
                      "QED Weighted", 
                      "CX LogP", 
                      "CX LogD", 
                      "Heavy Atoms"]]
              )
X[0:5]
array([[ 0.  ,  0.91,  2.05,  0.62, 21.  ],
       [ 2.  ,  0.16,  1.51, -0.41, 48.  ],
       [ 2.  ,  0.2 ,  5.05,  3.27, 46.  ],
       [ 0.  ,  0.53,  3.21,  3.21, 24.  ],
       [ 1.  ,  0.14,  2.8 ,  2.8 , 37.  ]])
# Define y variable
y = np.asarray(df_ml["Max_Phase"])
y[0:5]
array([0, 0, 0, 0, 0])


Training and testing sets
# Split dataset into training & testing sets

# Random number generator - note: this may produce different result each time
#rng = np.random.RandomState(0) 

# Edited post to use random_state = 250 
# to be the same as ML series 1 for reproducible result
X_train, X_test, y_train, y_test = train_test_split(X, y, test_size = 0.2, random_state = 250)
print('Training set:', X_train.shape, y_train.shape)
print('Testing set:', X_test.shape, y_test.shape)
Training set: (1515, 5) (1515,)
Testing set: (379, 5) (379,)


Preprocessing data
# Normalise & clean the dataset
# Fit on the training set - not on testing set as this might lead to data leakage
# Transform on the testing set
X = preprocessing.StandardScaler().fit(X_train).transform(X_test)
X[0:5]
array([[-0.61846489, -0.79518088,  0.57523481,  0.76170581,  0.47638078],
       [-0.61846489, -1.24006401,  1.27389185,  1.25867492,  0.37925834],
       [-0.61846489,  0.4949802 , -0.18352175,  0.12634023, -1.27182321],
       [-0.61846489, -0.79518088,  0.03433905,  0.28360894, -0.68908855],
       [-0.61846489, -0.48376269,  0.61655324,  0.79630492, -0.20347633]])


Fitting LR classifier on training set

One major difference to the LR classifier this time was that cross-validation was included by using the LogisticRegressionCV model while fitting the training data.

# Import logistic regression CV estimator
from sklearn.linear_model import LogisticRegressionCV

# Change to LogisticRegressionCV() - LR with built-in cross validation
# Create an instance of logistic regression CV classifier and fit the data
LogR = LogisticRegressionCV().fit(X_train, y_train)
LogR
LogisticRegressionCV()
In a Jupyter environment, please rerun this cell to show the HTML representation or trust the notebook.
On GitHub, the HTML representation is unable to render, please try loading this page with nbviewer.org.


Applying LogisticRegressionCV classifier on testing set for prediction
y_mp = LogR.predict(X_test)
y_mp
array([0, 0, 1, 0, 0, 1, 0, 0, 1, 0, 1, 1, 0, 1, 1, 0, 0, 0, 0, 0, 0, 0,
       0, 0, 1, 0, 0, 0, 1, 0, 1, 1, 0, 1, 1, 1, 0, 0, 1, 0, 0, 1, 0, 0,
       1, 1, 1, 0, 1, 0, 0, 0, 1, 1, 1, 1, 1, 1, 1, 0, 0, 0, 0, 0, 0, 1,
       1, 0, 1, 1, 0, 1, 1, 0, 1, 0, 0, 1, 1, 0, 1, 1, 1, 0, 1, 0, 1, 1,
       0, 0, 0, 0, 1, 0, 1, 0, 1, 0, 0, 0, 0, 1, 1, 1, 0, 0, 0, 1, 1, 1,
       1, 1, 1, 0, 0, 0, 1, 0, 0, 1, 1, 1, 0, 0, 0, 0, 1, 1, 1, 1, 1, 0,
       1, 0, 1, 1, 0, 0, 0, 0, 0, 1, 0, 1, 0, 1, 0, 1, 0, 0, 1, 0, 0, 1,
       0, 1, 1, 1, 0, 0, 0, 1, 0, 1, 0, 1, 0, 0, 1, 0, 1, 0, 0, 0, 0, 0,
       0, 1, 1, 0, 0, 0, 1, 1, 1, 0, 1, 1, 0, 0, 1, 0, 1, 1, 1, 0, 0, 0,
       0, 0, 1, 1, 1, 0, 0, 1, 0, 0, 1, 0, 1, 1, 0, 0, 1, 1, 0, 0, 1, 1,
       0, 1, 0, 1, 0, 0, 1, 0, 0, 1, 1, 0, 0, 0, 1, 0, 0, 1, 0, 0, 0, 1,
       0, 1, 1, 1, 1, 1, 1, 1, 0, 0, 1, 1, 0, 0, 0, 1, 0, 0, 1, 0, 0, 0,
       1, 0, 0, 0, 1, 1, 0, 0, 0, 1, 1, 1, 1, 0, 1, 0, 1, 1, 1, 0, 1, 0,
       0, 1, 1, 0, 0, 1, 0, 0, 1, 0, 1, 0, 1, 0, 0, 1, 1, 0, 0, 1, 1, 1,
       0, 1, 1, 0, 1, 0, 1, 0, 1, 1, 0, 1, 0, 1, 0, 0, 1, 0, 1, 0, 1, 0,
       1, 0, 1, 1, 1, 1, 0, 1, 0, 0, 0, 1, 1, 1, 1, 1, 0, 0, 0, 0, 1, 0,
       1, 0, 1, 1, 0, 0, 1, 0, 0, 1, 1, 0, 1, 1, 1, 1, 0, 0, 0, 0, 0, 1,
       0, 0, 1, 0, 0])

Converting predicted values into a dataframe
# Predicted values were based on log odds
# Use describe() method to get characteristics of the distribution
pred = pd.DataFrame(LogR.predict_log_proba(X))
pred.describe()
0 1
count 379.000000 379.000000
mean -1.062787 -0.442845
std 0.235029 0.109879
min -2.435645 -0.793868
25% -1.165361 -0.504319
50% -1.049435 -0.430992
75% -0.926131 -0.373691
max -0.601649 -0.091612

Alternatively, a quicker way to get predicted probabilities was via predict_proba() method in scikit-learn.

y_mp_proba = LogR.predict_proba(X_test)
# Uncomment below to see the predicted probabilities printed
#print(y_mp_proba)


Converting predicted probabilities into a dataframe
# Use describe() to show distributions
y_mp_prob = pd.DataFrame(y_mp_proba)
y_mp_prob.describe()
0 1
count 379.000000 379.000000
mean 0.482928 0.517072
std 0.172099 0.172099
min 0.009285 0.144482
25% 0.372812 0.391971
50% 0.511104 0.488896
75% 0.608029 0.627188
max 0.855518 0.990715


Cross-validation & hyper-parameter tuning


Cross-validation

Cross-validation was designed to minimise sample loss if all of our datasets were partitioned into three lots for training, testing and validation purposes. Readers might notice an additional set of data for validation here. One of the biggest reasons to add this validation set was that often overfitting could happen on the testing set with testing data being leaked into the model, due to parameter tweaking until the model performed optimally as desired. By having a validation set of the data, this overfitting problem could be avoided.

In general, model training could take place initially on the training set, with the validation set used for first evaluation, which would be followed by a final evaluation on the testing set if the model testing worked as expected. The “cross” part of the cross-validation was the part that described the process of splitting the training data into many smaller number (“k”) of sets, which was also why cross-validation was also known as “k-fold cross-validation”. With the use of k-fold cross-validation, the training set was essentially equivalent to k-1 of the folds of the training data. The trained model would then be validated by using the remaining parts of the training data, which was almost like being used as a testing data to measure the performance of the trained model.

Note

In short, cross-validation was commonly used as an out-of-sample evaluation metric, where each observation was used for both training and testing, leading to more effective use of data. It was often used for hyper-parameter tuning to avoid overfitting, where parameters could be optimised via grid search techniques (such as GridSearchCV).


Decoding LogisticRegressionCV classifier

Since we’ve used LogisticRegressionCV classifier for the LR models, this meant it would be unnecessary to use GridSearchCV again according to the definition of the estimatorCV as shown below.

As quoted from scikit-learn on cross-validation estimator:

An estimator that has built-in cross-validation capabilities to automatically select the best hyper-parameters (see the User Guide). Some example of cross-validation estimators are ElasticNetCV and LogisticRegressionCV. Cross-validation estimators are named EstimatorCV and tend to be roughly equivalent to GridSearchCV(Estimator(), …). The advantage of using a cross-validation estimator over the canonical estimator class along with grid search is that they can take advantage of warm-starting by reusing precomputed results in the previous steps of the cross-validation process. This generally leads to speed improvements. An exception is the RidgeCV class, which can instead perform efficient Leave-One-Out (LOO) CV. By default, all these estimators, apart from RidgeCV with an LOO-CV, will be refitted on the full training dataset after finding the best combination of hyper-parameters.

Therefore, the cross validation part for the LR model was taken care of by the LogisticRegressionCV classifier. However, I wanted to find out more about this particular estimator, so to further dissect LogisticRegressionCV classifer, Stratified K-Folds cross-validator was actually found to be used in its default setting. One of the parameters in the classifier that was closely related to the Stratified K-Folds was the cv parameter. It was a cross-validation generator that could be tuned by providing integers as its equivalent number of folds used. Its default value for LogisticRegressionCV was set as “None”, which was equivalent to and changed from 3-fold to 5-fold in scikit-learn version 0.22.


Hyper-parameter tuning - how parameters affect LR model

To explicitly see the details of all the parameters used after the cross-validation, the names and values of these parameters could be checked for the estimator by using the code below.

```{python}
# To find the parameters of any ML estimator as suggested by *scikit-learn*
estimator.get_params()
```

In this example, the LR model built was named LogR. All the parameters used for LogR by the LogisticRegressionCV classifer were:

LogR.get_params()
{'Cs': 10,
 'class_weight': None,
 'cv': None,
 'dual': False,
 'fit_intercept': True,
 'intercept_scaling': 1.0,
 'l1_ratios': None,
 'max_iter': 100,
 'multi_class': 'auto',
 'n_jobs': None,
 'penalty': 'l2',
 'random_state': None,
 'refit': True,
 'scoring': None,
 'solver': 'lbfgs',
 'tol': 0.0001,
 'verbose': 0}

However, by showing this set of parameters used by LogisticRegressionCV classifier wouldn’t really tell much about whether any of these parameters were indeed the best ones to fit the model with. So to find out how these parameters influenced the LR model, it was probably best to run a test by using several different parameters on the model to observe the effects. I’ve had two parameters in mind that I thought would affect the confusion matrix at least - cv and random_state parameters after doing some manual trial and errors by changing the cv and random_state values in the code. However, upon reading and digging further in the online information and resource pools, I quickly realised that cv parameter would probably matter more than random_state parameter. This was based on this line from scikit-learn about the LogisticRegressionCV classifer,

For the grid of Cs values and l1_ratios values, the best hyperparameter is selected by the cross-validator StratifiedKFold, but it can be changed using the cv parameter.

So it appeared that changing cv parameter could affect Cs and l1_ratios values as well. Also from scikit-learn documentation on LR, other parameters that could be tuned were:

  • solvers - algorithms used in classifiers

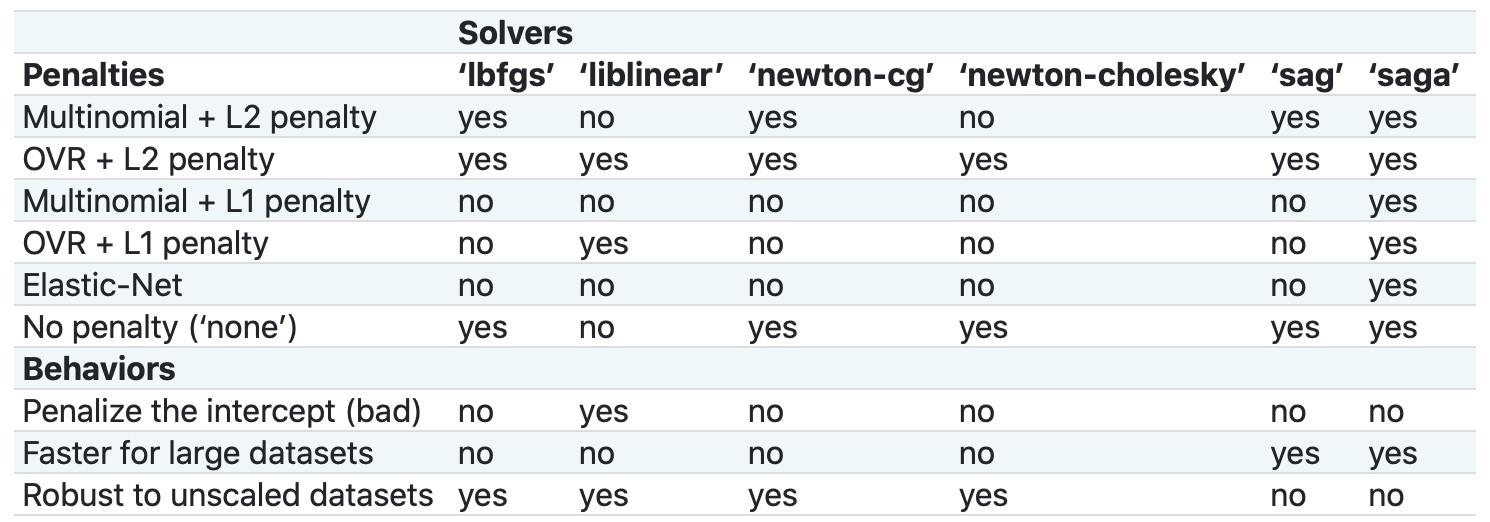
  • penalties (or regularisation) - aims to reduce model generalisation errors and regulate or prevent overfitting

  • C - controls regularisation or penalty strengths (which would be already taken care of in this case if using LogisticRegressionCV classifier).

Summary table for different penalties supported by different solvers in logistic regression, adapted from scikit-learn - https://scikit-learn.org/stable/modules/linear_model.html#logistic-regression. Note: only certain penalties and solvers work together, OVR = One-vs-Rest.

A few other online projects or tutorials using logistic regression in scikit-learn had also mentioned that logistic regression in general did not have a lot of key hyper-parameters for tuning. Another post I happened to bump into even concluded that better time should be used to link the model results with the actual business metrics instead, rather than trying to use hyper-parameter tuning on the LR model. Nevertheless, I still wanted to see how these parameters would affect the LR model in this case, even if it was of minor significance, so that I would fully understand how all of them would work together, and how tuning hyper-parameters would be like.

In order to search and test the LR parameters on the different models that would be generated in the test, I’ve opted to use RepeatedStratifiedKFold as the cross-validation method (which was the default cross-validator method used in LogisticRegressionCV classifier). The “Repeated” version of it would repeat Stratified K-Fold at the stated (n) times. Because of this, GridSearchCV would then be used to exhaustively search for all the best parameters in this case, with the aim to see how the changes in parameters would affect the accuracy scores for each model.

# Re-sampled y variable randomly so that there were same numbers of samples as X variables
y = np.asarray(df_ml["Max_Phase"].sample(n = 379, random_state = 250))
y.shape
(379,)
# Code adapted from: https://machinelearningmastery.com/hyperparameters-for-classification-machine-learning-algorithms/

from sklearn.model_selection import RepeatedStratifiedKFold
from sklearn.model_selection import GridSearchCV

# Set up LR model to test (the estimatorCV version)
model = LogisticRegressionCV()

# Set up parameters to test
# Note: default value for cv = 5-fold
cv = [5, 10, 20, 30]
# Note: default value for Cs = 10 (integers or floats only)
Cs = [1, 10, 50, 100]
# Note: default solver = "lbfgs"
solvers = ["lbfgs", "liblinear", "newton-cg", "newton-cholesky"]
# "sag", "saga" not used as the dataset used here was small
# they were mainly used for large datasets for speed
penalty = ["l2"]

# Specify grid for parameters to test in grid search
grid = dict(cv = cv, Cs = Cs, solver = solvers, penalty = penalty)

# Specify type of cross-validation method to be used
CV = RepeatedStratifiedKFold(n_splits = 5, n_repeats = 2, random_state = 2)

# Set up grid search
# Specify grid search parameters
grid_search = GridSearchCV(
  # Specify model
  estimator = model,
  # Specify parameters to test
  param_grid = grid,
  # Number of jobs to run in parallel 
  # 1 = no parallel jobs; 
  # None = unset, but could be interpreted as "1" unless otherwise specified; 
  # -1 = all processors used
  n_jobs = -1,
  # Type of cross-validation method to be used 
  # (if none set, default 5-fold cv will be used)
  cv = CV, 
  # Type of scoring to be used to evaluate the model
  scoring = "accuracy",
  # Value to assign to the "scoring" of the model 
  # if an error occurs during model fitting
  error_score = 0
  )
  
# fit the grid search on X and y variables
grid_result = grid_search.fit(X, y)

# Results with means & standard deviations of accuracy scores 
# with parameters used
print("Best mean test score: %f using %s" % (grid_result.best_score_, grid_result.best_params_))
means = grid_result.cv_results_["mean_test_score"]
std = grid_result.cv_results_["std_test_score"]
params = grid_result.cv_results_["params"]
for mean, stdv, param in zip(means, std, params):
    print("%f (%f) with: %r" % (mean, stdv, param))
Best mean test score: 0.699263 using {'Cs': 50, 'cv': 5, 'penalty': 'l2', 'solver': 'lbfgs'}
0.532982 (0.005887) with: {'Cs': 1, 'cv': 5, 'penalty': 'l2', 'solver': 'lbfgs'}
0.670281 (0.055017) with: {'Cs': 1, 'cv': 5, 'penalty': 'l2', 'solver': 'liblinear'}
0.532982 (0.005887) with: {'Cs': 1, 'cv': 5, 'penalty': 'l2', 'solver': 'newton-cg'}
0.532982 (0.005887) with: {'Cs': 1, 'cv': 5, 'penalty': 'l2', 'solver': 'newton-cholesky'}
0.532982 (0.005887) with: {'Cs': 1, 'cv': 10, 'penalty': 'l2', 'solver': 'lbfgs'}
0.670281 (0.055017) with: {'Cs': 1, 'cv': 10, 'penalty': 'l2', 'solver': 'liblinear'}
0.532982 (0.005887) with: {'Cs': 1, 'cv': 10, 'penalty': 'l2', 'solver': 'newton-cg'}
0.532982 (0.005887) with: {'Cs': 1, 'cv': 10, 'penalty': 'l2', 'solver': 'newton-cholesky'}
0.532982 (0.005887) with: {'Cs': 1, 'cv': 20, 'penalty': 'l2', 'solver': 'lbfgs'}
0.670281 (0.055017) with: {'Cs': 1, 'cv': 20, 'penalty': 'l2', 'solver': 'liblinear'}
0.532982 (0.005887) with: {'Cs': 1, 'cv': 20, 'penalty': 'l2', 'solver': 'newton-cg'}
0.532982 (0.005887) with: {'Cs': 1, 'cv': 20, 'penalty': 'l2', 'solver': 'newton-cholesky'}
0.532982 (0.005887) with: {'Cs': 1, 'cv': 30, 'penalty': 'l2', 'solver': 'lbfgs'}
0.670281 (0.055017) with: {'Cs': 1, 'cv': 30, 'penalty': 'l2', 'solver': 'liblinear'}
0.532982 (0.005887) with: {'Cs': 1, 'cv': 30, 'penalty': 'l2', 'solver': 'newton-cg'}
0.532982 (0.005887) with: {'Cs': 1, 'cv': 30, 'penalty': 'l2', 'solver': 'newton-cholesky'}
0.697930 (0.041930) with: {'Cs': 10, 'cv': 5, 'penalty': 'l2', 'solver': 'lbfgs'}
0.696614 (0.041302) with: {'Cs': 10, 'cv': 5, 'penalty': 'l2', 'solver': 'liblinear'}
0.697930 (0.041930) with: {'Cs': 10, 'cv': 5, 'penalty': 'l2', 'solver': 'newton-cg'}
0.697930 (0.041930) with: {'Cs': 10, 'cv': 5, 'penalty': 'l2', 'solver': 'newton-cholesky'}
0.696614 (0.041720) with: {'Cs': 10, 'cv': 10, 'penalty': 'l2', 'solver': 'lbfgs'}
0.696614 (0.041720) with: {'Cs': 10, 'cv': 10, 'penalty': 'l2', 'solver': 'liblinear'}
0.696614 (0.041720) with: {'Cs': 10, 'cv': 10, 'penalty': 'l2', 'solver': 'newton-cg'}
0.696614 (0.041720) with: {'Cs': 10, 'cv': 10, 'penalty': 'l2', 'solver': 'newton-cholesky'}
0.693982 (0.051953) with: {'Cs': 10, 'cv': 20, 'penalty': 'l2', 'solver': 'lbfgs'}
0.699246 (0.039988) with: {'Cs': 10, 'cv': 20, 'penalty': 'l2', 'solver': 'liblinear'}
0.693982 (0.051953) with: {'Cs': 10, 'cv': 20, 'penalty': 'l2', 'solver': 'newton-cg'}
0.693982 (0.051953) with: {'Cs': 10, 'cv': 20, 'penalty': 'l2', 'solver': 'newton-cholesky'}
0.695298 (0.041882) with: {'Cs': 10, 'cv': 30, 'penalty': 'l2', 'solver': 'lbfgs'}
0.695298 (0.041882) with: {'Cs': 10, 'cv': 30, 'penalty': 'l2', 'solver': 'liblinear'}
0.695298 (0.041882) with: {'Cs': 10, 'cv': 30, 'penalty': 'l2', 'solver': 'newton-cg'}
0.695298 (0.041882) with: {'Cs': 10, 'cv': 30, 'penalty': 'l2', 'solver': 'newton-cholesky'}
0.699263 (0.043226) with: {'Cs': 50, 'cv': 5, 'penalty': 'l2', 'solver': 'lbfgs'}
0.699263 (0.043226) with: {'Cs': 50, 'cv': 5, 'penalty': 'l2', 'solver': 'liblinear'}
0.699263 (0.043226) with: {'Cs': 50, 'cv': 5, 'penalty': 'l2', 'solver': 'newton-cg'}
0.699263 (0.043226) with: {'Cs': 50, 'cv': 5, 'penalty': 'l2', 'solver': 'newton-cholesky'}
0.697930 (0.041095) with: {'Cs': 50, 'cv': 10, 'penalty': 'l2', 'solver': 'lbfgs'}
0.697930 (0.041095) with: {'Cs': 50, 'cv': 10, 'penalty': 'l2', 'solver': 'liblinear'}
0.697930 (0.041095) with: {'Cs': 50, 'cv': 10, 'penalty': 'l2', 'solver': 'newton-cg'}
0.697930 (0.041095) with: {'Cs': 50, 'cv': 10, 'penalty': 'l2', 'solver': 'newton-cholesky'}
0.692667 (0.049633) with: {'Cs': 50, 'cv': 20, 'penalty': 'l2', 'solver': 'lbfgs'}
0.693982 (0.049566) with: {'Cs': 50, 'cv': 20, 'penalty': 'l2', 'solver': 'liblinear'}
0.692667 (0.049633) with: {'Cs': 50, 'cv': 20, 'penalty': 'l2', 'solver': 'newton-cg'}
0.692667 (0.049633) with: {'Cs': 50, 'cv': 20, 'penalty': 'l2', 'solver': 'newton-cholesky'}
0.693982 (0.043222) with: {'Cs': 50, 'cv': 30, 'penalty': 'l2', 'solver': 'lbfgs'}
0.692667 (0.042897) with: {'Cs': 50, 'cv': 30, 'penalty': 'l2', 'solver': 'liblinear'}
0.693982 (0.043222) with: {'Cs': 50, 'cv': 30, 'penalty': 'l2', 'solver': 'newton-cg'}
0.693982 (0.043222) with: {'Cs': 50, 'cv': 30, 'penalty': 'l2', 'solver': 'newton-cholesky'}
0.696632 (0.042453) with: {'Cs': 100, 'cv': 5, 'penalty': 'l2', 'solver': 'lbfgs'}
0.695298 (0.041047) with: {'Cs': 100, 'cv': 5, 'penalty': 'l2', 'solver': 'liblinear'}
0.696632 (0.042453) with: {'Cs': 100, 'cv': 5, 'penalty': 'l2', 'solver': 'newton-cg'}
0.696632 (0.042453) with: {'Cs': 100, 'cv': 5, 'penalty': 'l2', 'solver': 'newton-cholesky'}
0.697930 (0.040672) with: {'Cs': 100, 'cv': 10, 'penalty': 'l2', 'solver': 'lbfgs'}
0.696614 (0.040455) with: {'Cs': 100, 'cv': 10, 'penalty': 'l2', 'solver': 'liblinear'}
0.697930 (0.040672) with: {'Cs': 100, 'cv': 10, 'penalty': 'l2', 'solver': 'newton-cg'}
0.697930 (0.040672) with: {'Cs': 100, 'cv': 10, 'penalty': 'l2', 'solver': 'newton-cholesky'}
0.693982 (0.050944) with: {'Cs': 100, 'cv': 20, 'penalty': 'l2', 'solver': 'lbfgs'}
0.693982 (0.049566) with: {'Cs': 100, 'cv': 20, 'penalty': 'l2', 'solver': 'liblinear'}
0.693982 (0.050944) with: {'Cs': 100, 'cv': 20, 'penalty': 'l2', 'solver': 'newton-cg'}
0.693982 (0.050944) with: {'Cs': 100, 'cv': 20, 'penalty': 'l2', 'solver': 'newton-cholesky'}
0.695298 (0.040623) with: {'Cs': 100, 'cv': 30, 'penalty': 'l2', 'solver': 'lbfgs'}
0.692667 (0.042897) with: {'Cs': 100, 'cv': 30, 'penalty': 'l2', 'solver': 'liblinear'}
0.695298 (0.040623) with: {'Cs': 100, 'cv': 30, 'penalty': 'l2', 'solver': 'newton-cg'}
0.695298 (0.040623) with: {'Cs': 100, 'cv': 30, 'penalty': 'l2', 'solver': 'newton-cholesky'}


Results & discussions

Trends observed from the grid search above (when penalty = l2):

  • For Cs = 1, the best accuracy score was 0.670281 across all 4 different cv parameters (5, 10, 20, 30), and the best solver was liblinear

  • For Cs = 10, the best accuracy score was 0.699246 for cv = 20 and when solver was set as liblinear

  • For Cs = 50, the best accuracy score was 0.699263 for cv = 5 across all 4 solvers

  • For Cs = 100, the best accuracy score was 0.697930 for cv = 10 across 3 out of 4 solvers only, which were lbfgs, newton-cg and newton-cholesky

It appeared that for smaller values of Cs, liblinear might be more suitable than the default lbfgs solver. However, for higher values of Cs, e.g. 50 and above, liblinear might not always be the best solver. The values of Cs and cv parameters that generated the best mean accuracy score were 50 and 5 respectively. The best mean accuracy score produced was 0.699263 with a standard deviation of 0.043226. Solver-wise, there were actually 3 other solvers, liblinear, newton-cg and newton-cholesky, along with the default lbfgs that generated the same mean accuracy score and standard deviations while using Cs = 50 and cv = 5. In my initial LogisticRegressionCV model, I used a different value of Cs parameter (at 10), but with the same cv and penalty parameters.

Therefore, for the next ML series 3, the plan was to re-train the LogisticRegression model with the newly-discovered best parameters and re-evaluate the model to see if there would be any particular differences. Although currently I suspected the differences might be small (which probably also echoed other ML work on different datasets that also used LR), since the accuracy scores generated from this grid search and ML series 1 were very similar. However, the goal of this post was to understand how cross-validation could be used for hyper-parameter tuning to find the optimal parameters to avoid overfitting a ML model, and this was likely more applicable in other ML approaches.


Final words

Note

Feel free to skip this final part as this was really me speaking my thoughts out loud about my portfolio lately.

I once read a blog post on learning ML, which has suggested to go broadly in topics, then go deep in one of them, which I’ve agreed wholeheartedly as the approach to go about in the tech world, since there are no ways on earth to learn absolutely everything completely (even OpenAI’s ChatGPT has limits - being restricted by the amount and types of input data being fed into the GPT). So, since I’ve branched into 3 programming languages so far, I’ve decided not to expand further into new programming languages for now, to avoid being “half-bucket-full” for everything, I should really narrow down my focus now. To name the 3 programming languages in the order I’ve learnt them, they are Python, R and Rust. In that, I’m most comfortable with Python as that is my first language, then it’s R, followed by Rust, which is almost brand new. I think right now is a good time for me to go deep into an area that has always caught my attentions. So I’ll be concentrating more on ML in my portfolio in the near future.


References